| Leveraging historical cost data from past projects is a challenge that most companies in the industry face because their information is often siloed or stored in different locations and formats (estimating platforms, spreadsheets, PDF reports, etc.). When all your projects are entered into Join, the cost data is stored in a central location and is easily leveraged using the Project Comparisons report. The Project Comparisons report can be used to quickly create a new Milestone estimate or budget by averaging the $/UNIT costs of past projects, and can be organized by any Categorization. |
Included in Join Benchmarking
|
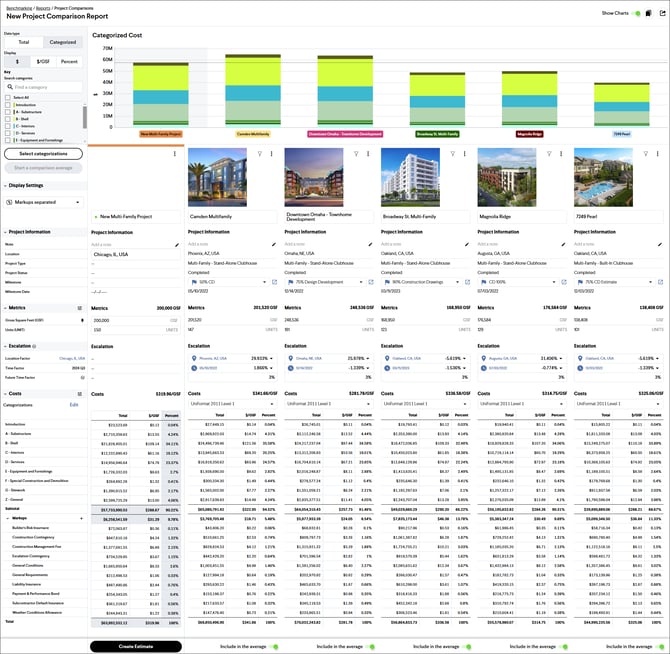
Creating a Project Comparisons Report
From the Benchmarking Page
To create a Project Comparisons report from the Benchmarking page, follow these steps:
- Click Benchmarking in the navigation panel.
- Click the Explore tab.
- Sort and filter the list of projects and click the Add to compare checkbox next to all projects you want to add to the report.
- Click the Create a comparison report button in the bottom right corner.
From the Reports Page in a Project
To create a Project Comparisons report within a project, follow these steps:
- While in a project, click Reports in the navigation panel.
- Click the New Report button and select Project Comparison.
- Sort and filter the list of projects and select the checkboxes for all projects you want to add to the report.
- Click the Create report button to create the report with the selected projects.
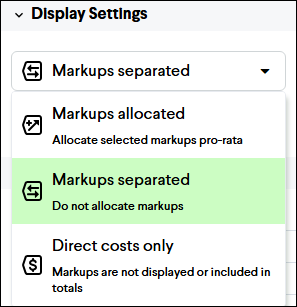
Display Settings
The display settings are used to change how cost data is displayed. In the Display Settings section, click on the drop-down list to select how direct costs and markups will be displayed in the report. This functions similarly to the display cost settings for a project in Join.
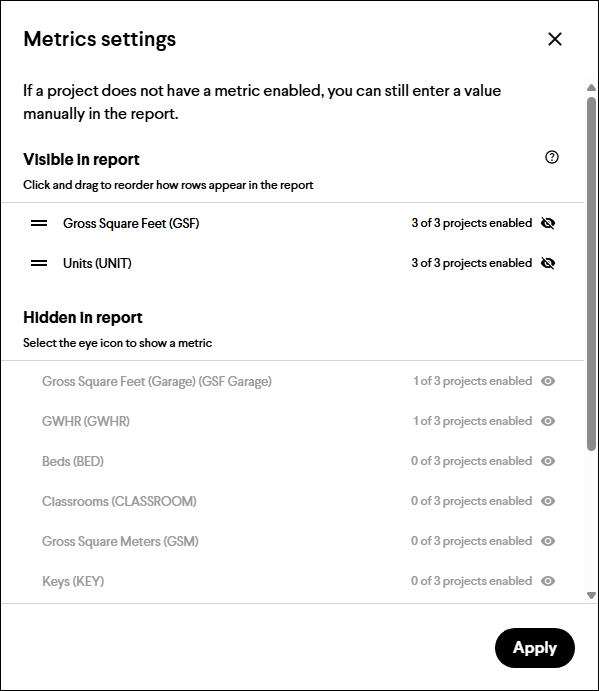
Metrics
In the Metrics section click the Settings ![]() button to select the Units of Measure to be used as the unit price ($/UNIT) for cost calculations and comparisons. You can select from any of the built-in Units of Measure or custom ones you've created for your projects. To change the Unit of Measure used in the calculations click the Pin
button to select the Units of Measure to be used as the unit price ($/UNIT) for cost calculations and comparisons. You can select from any of the built-in Units of Measure or custom ones you've created for your projects. To change the Unit of Measure used in the calculations click the Pin ![]() button when hovering next to a Unit of Measure.
button when hovering next to a Unit of Measure.

Escalation
The Escalation section can be used to adjust historical costs based on location and time. Escalation rates can be entered manually or automatically applied using Gordian's RSMeans Construction Cost Indices (built-in and maintained by Join), or your own custom cost indices. The Escalating Historical Costs article provides a detailed breakdown of how to correctly apply escalation factors to your data.
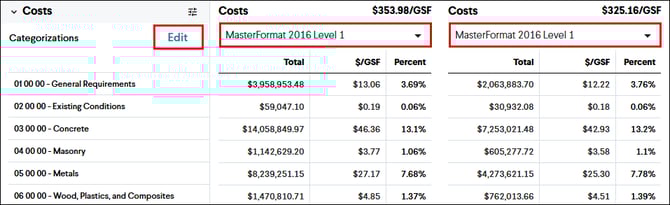
Costs
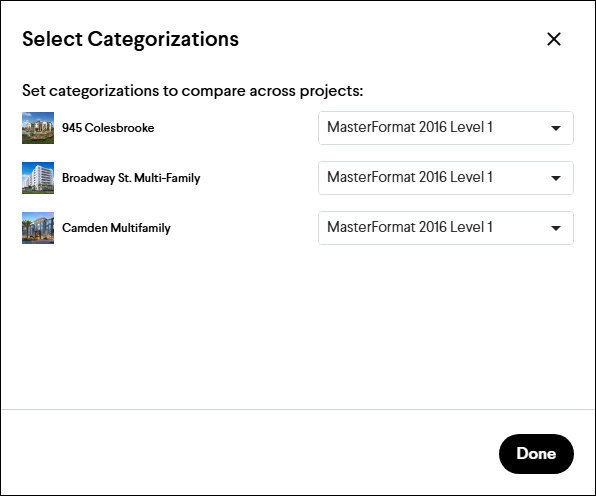
Selecting a Categorization
Break down the costs of each project by a specific Categorization. You can either select the Categorization for each project using the drop-down menu in the column of each project or by clicking the Edit button in the Costs section and then selecting the Categorization for each project in the menu that opens.
Highlighting Highs and Lows
To highlight the high and low unit prices for each category, in the Costs section, click the Settings ![]() button and click Show highs and lows of each line. The checkmark to the right indicates that it is enabled. High unit costs will be highlighted in red, and low unit costs will be highlighted in green.
button and click Show highs and lows of each line. The checkmark to the right indicates that it is enabled. High unit costs will be highlighted in red, and low unit costs will be highlighted in green.

Include or Exclude $0.00 in Average Calculations
The average unit cost of each category can be calculated in two ways. You can choose to include or exclude $0.00 unit costs in the average calculation. In the Costs section, click the Settings ![]() button and select Include "$0.00" in Average calculation. The checkmark to the right indicates that $0.00 unit costs are included in the calculation.
button and select Include "$0.00" in Average calculation. The checkmark to the right indicates that $0.00 unit costs are included in the calculation.
Creating a Comparison Average
After the projects have been added to a Project Comparisons report, a new average column can be added to help build a conceptual estimate for your project by following these steps:
- Click the Start a comparison average button in the top left of the report
- Rename the column based on your project or Milestone (optional)
- Upload an image and choose a color for the column by clicking the Options
 button in the top right corner of the column and selecting Customize
 - Enter a quantity for the selected Units of Measure for the project, and the total costs will be calculated based on the average $/UNIT of the comparable projects
Tip: You can manually override the average $/UNIT or average Total for each row by clicking into the cell and editing the cost value. Cells that have been overridden will be indicated with a green dot. Clicking the green dot will allow you to reset the value back to the average or add a note explaining why it was changed.
Saving a Report
The Project Comparisons report can be saved and accessed at any time from the Reports page using the following steps:
- Click the Save as Report button in the upper right-hand corner of the report
- Enter a report name (required) and a description (optional)
- Click the Confirm button
Tip: If you make changes to a saved report, you will also have the option to select Save Changes, Save a copy..., or Revert to last Saved Report in the Report dropdown button.
Sharing a Saved Report
Once you’ve saved a Report, you can choose to share it with others from your company who also have access to Benchmarking. All shared users will have full edit access to the shared report.
Share From the Benchmarking Reports Page
To share a report from the Benchmarking Reports page, follow these steps:
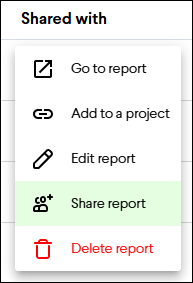
- Click Benchmarking in the navigation panel, and then click the Reports tab
- Click the options
button to the right of the saved report
- Select Share report
- Click the check box next to each teammate you want to share the report with
- Click the Share button in the bottom right
Share From the Project Comparison Report
To share a report while editing a Project Comparisons report, follow these steps:
- Open a saved Project Comparisons report
- Click the Share button at the top of the report
- Click the check box next to each teammate you want to share the report with
- Click the Share button at the bottom right.

Tip: You can remove a teammate from a saved report by following the same steps above and unchecking the box next to their name.
Accessing Project Comparisons
If your company doesn’t have access to Benchmarking, then please reach out to your account manager or email support@join.build. If your company has access but you don’t see it, then reach out to your company administrator and ask them to change your company role to Manager or above.