Customizable Reports
Cost Breakdowns
Summaries
Compare Data
Cost Breakdowns
Milestone Report Builder
The Milestone Report Builder is a configurable grid report that includes cost from the milestone estimate, budget, and can include item costs. The chart can be grouped by any category and can include cost details from items. The report can be further customized in the Edit Columns panel or the column edit menu to include whatever costs in any orientation you'd like. For more details, check out the Milestone Report Builder article.

Milestone Summary
The Milestone Summary Report is a flexible platform for updating teams on cost. The chart can be grouped by any categorization to break down the cost, and the list can represent the unique hierarchies of each project with the default grouping of UniFormat Level 1 followed by MasterFormat Level 1. For more details, check out the Milestone Summary Report article.

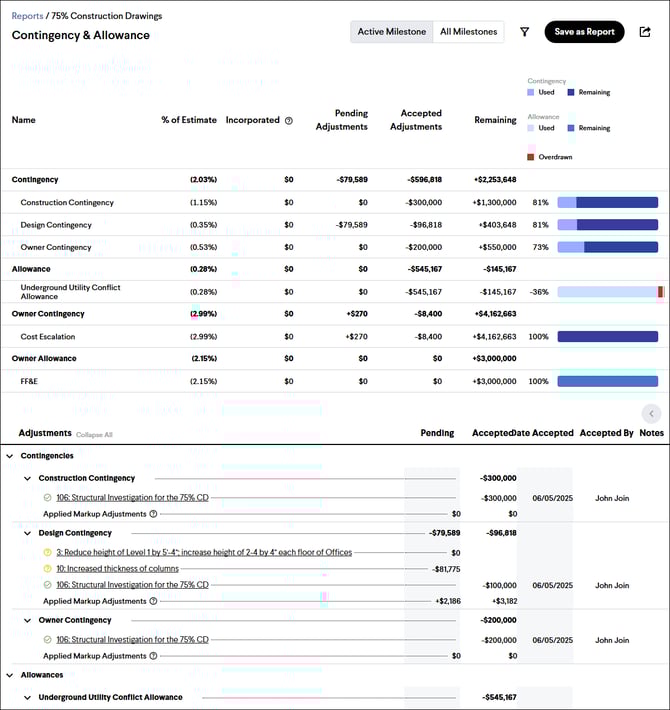
Contingency & Allowance
The Contingency and Allowance Report tracks the history of your Contingencies and Allowances across the lifecycle of your project. The report can be viewed for the active Milestone or across all Milestones. For more details, check out the Contingency & Allowance Report article.
Project Cost Breakdown
The Project Cost Breakdown Report shows how the costs in an Estimate or Budget are broken down into the different cost categories of Direct Costs, Markups, Contingencies, Allowances, and Owner Costs.

Summaries
Items List
This report will take you to the Items list for the Active Milestone with the standard filter set. The Items will be sorted by Item Number and no Group By will be applied. This is a great report for checking the overall potential of the current milestone and a global view of Items independent of their status.

Cost Trend Dashboard
The Dashboard is both a page that you can navigate to but also a report that can be saved, edited and shared. By default, the Cost Trendline will show the active milestone, the Estimate Chart will be grouped by your first categorization, and the Items Chart will be Grouped by Status.

Risk Register
The Risk Register report allows you to visualize potential risks to your project.

Compare Data
Project Comparison (Requires Access to Benchmarking)
Utilize your historical data to quickly build a cost model for a new project using comparable projects. For more details, check out the Creating a Project Comparison Report article.

Variance
The Variance Report is a powerful tool that can compare any two values (Budget, Estimate, or Running Total) from either the active milestone or a previous milestone. For more details, check out the Variance Report article.

Cost Trends By Category
The Cost Trends by Category report visualizes cost over time for each category within a selected categorization. For more details, check out the Cost Trends By Category Report article.
