The Variance Report is used to compare any two values (Estimate, Budget, or Running Total) from the same or different Milestones. The Variance Report is an excellent tool for displaying changes in cost. It presents this information with an Estimate Chart and/or a summary list of costs and Items. This report differs from others as it is generated with step-by-step instructions. Once the desired report is generated, it can be saved and shared with the team.
Accessing the Variance Report
From the Reports Page
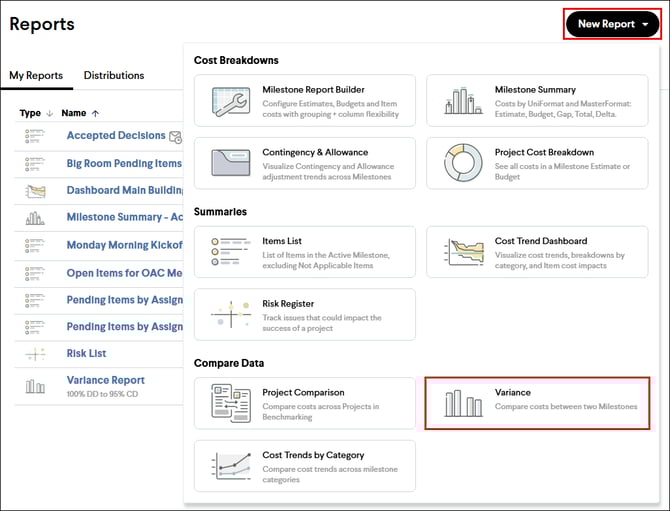
- Navigate to the Reports page.
- Click the New Report button.
- Select Variance in the report dropdown.
From the Milestones Page
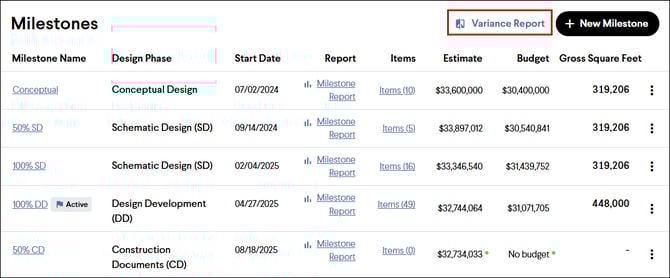
- Navigate to the Milestones page.
- Click the Variance Report hyperlink located in the top right of the page.
Creating a Variance Report
After accessing the Variance Report using one of the methods mentioned above, follow the steps below to finish creating the report.
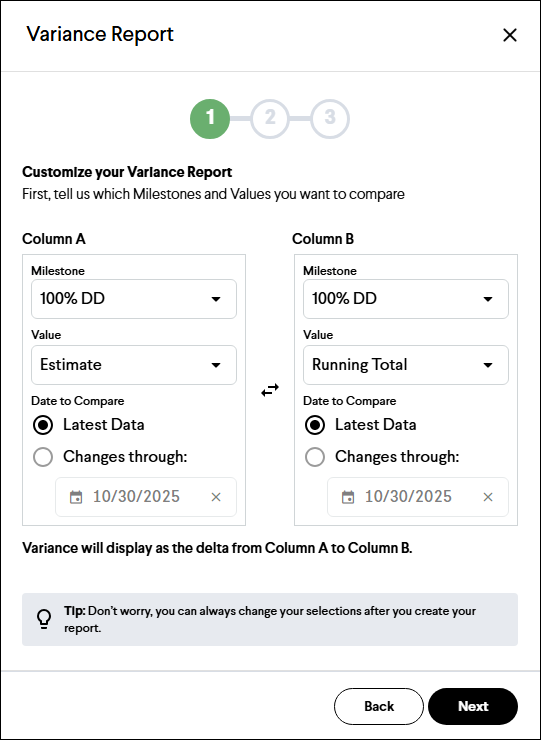
- Select which Milestones, values (Estimate, Budget, Running Total), and dates to compare, then click the Next button.
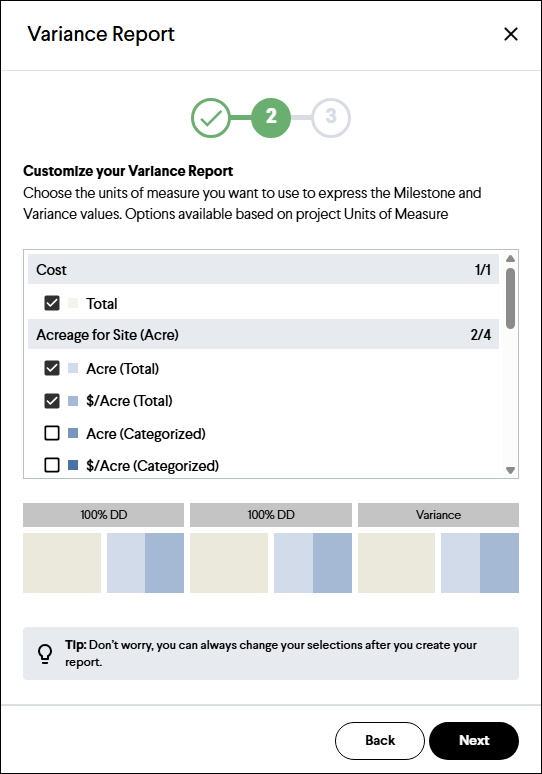
- Select the Quantities and Units of Measure columns to include in the report by clicking the check boxes, and then click the Next button.
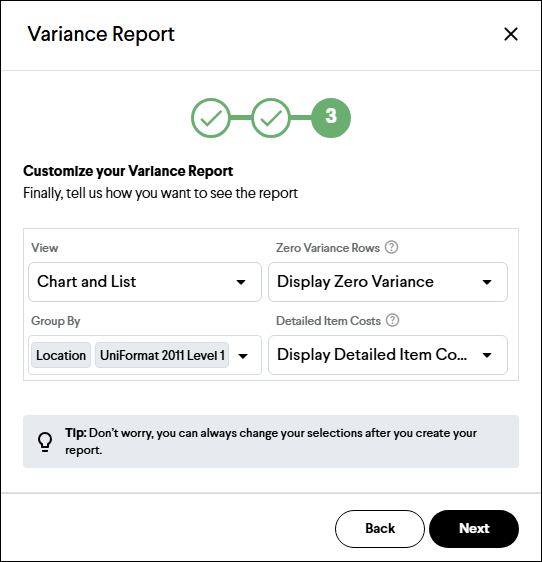
- Select your view settings (chart, list, or both), category grouping, variance display (show or hide zero variances), and Item cost display (show or hide detailed Item costs), and then click the Next button.
Tip: By using the date selection in the first step when selecting Running Total as the value, you can compare the same Milestone to see which Items have been accepted in the last week or two. This is an excellent report for weekly meetings, where you can add notes and save the report for future reference throughout the project.
Filtering the Report
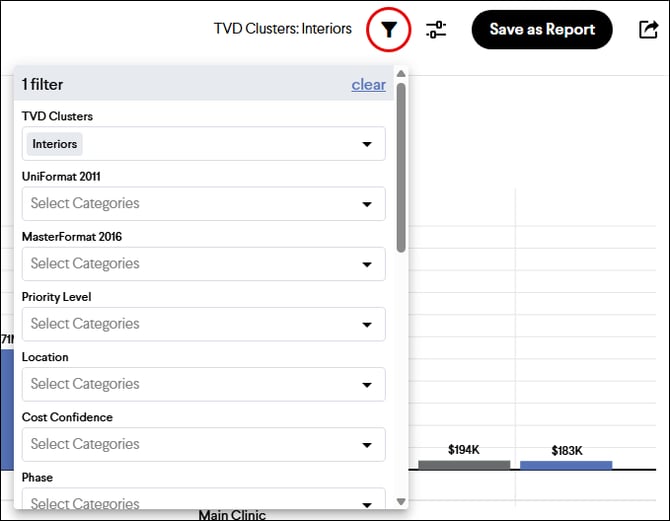
The report can be filtered by any categorization associated with the Estimate and Items. This filter will apply to both the chart and the list sections of the report. The filter tool is located in the upper right-hand corner of the page and looks like a funnel. Once selected, it will display a list of categorizations for filtering.
Customizing the Report
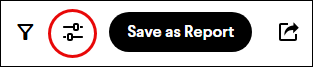
The report can be edited using the report settings menu, located in the upper right-hand corner. This will reopen the three-step process used when creating the report. You can repeat these steps again to edit the report settings.
Tip: Add notes to a Variance report to help provide context about why costs have changed.