The Estimate Chart is the second chart on the project Dashboard. It helps project teams visualize the costs on their projects broken down by different categories, as well as how decisions made on Items have affected the costs by category.
Estimate Chart Views
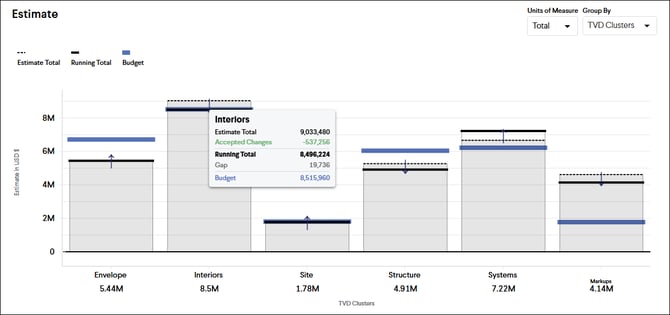
The Estimate Chart displays how the Estimate, Budget, and Running Total are currently trending for each category. The Estimate Chart can be quickly pivoted to break down project costs by different custom categories by grouping and filtering the chart. Hovering over a bar in the chart displays the project's cost summary for that category, similar to the navigation panel.
Tip: Adding a target Budget broken down by categories to your project will help you focus on specific areas of your project to target for potential cost savings. A pro-rata Budget can quickly be added to your project by starting with your imported estimate.
Cost Per Unit Display
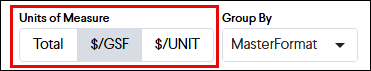
The costs can be displayed as either the Total cost or as a cost per unit of measure. After entering quantities for each unit of measure within the Milestone, you will be able to display the costs in the chart as a cost per unit, like $/GSF.