.svg)
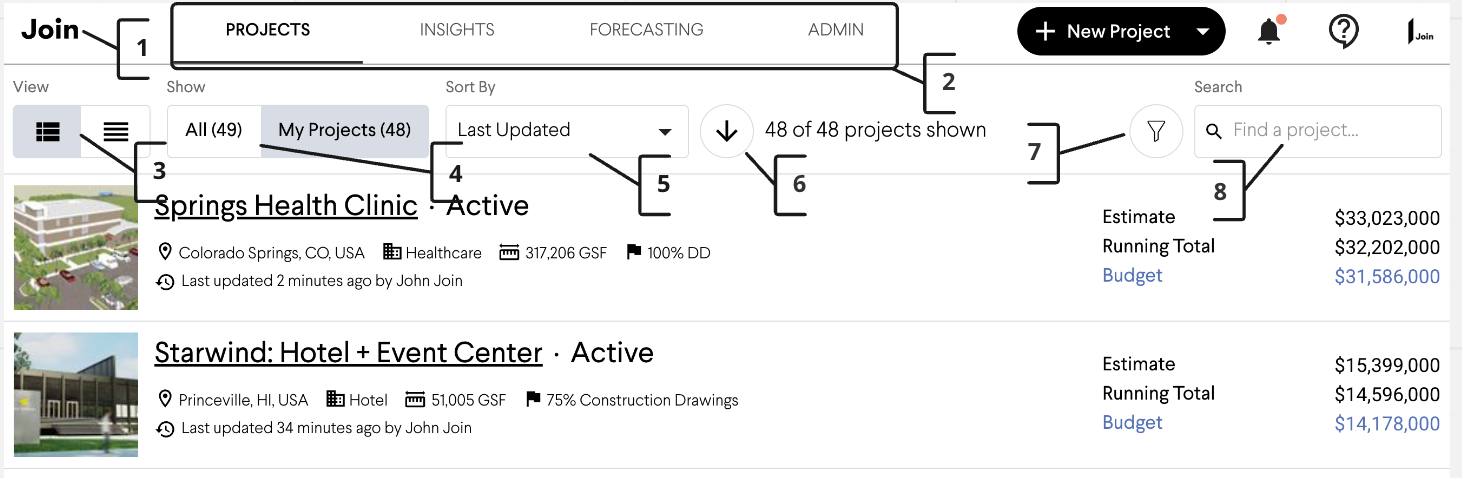
Project List Page
|
1 |
Home button | The home button navigates you to the Project List page from any page in Join. |
| 2 | Navigation Bar | The Navigation Bar contains the Project List, Insights, and Admin pages. |
| 3 | View (Cozy View, Compact View) | View toggles the Project list to a cozy view and compact view. The cozy view shows more project details but fewer projects on the visible page. The compact view shows fewer project details but more projects on the visible page. |
| 4 | Project(s) Filter | The Project Filter allows you to filter projects that you're invited from all the projects in your companies portfolio |
| 5 | Sort By drop-down | The Sort by drop-down menu sorts the list by the selected column header. |
| 6 | Sort By > Change Sort Direction Button | The Change Sort Direction button reverses the order of the selected sort field. |
| 7 | Filter Menu | The Project(s) show filter, filters down the page base on locations, type, and company. |
| 8 | Search bar | The search bar allows you to search for projects based on keywords in the project name or the project status |
Project Sidebar
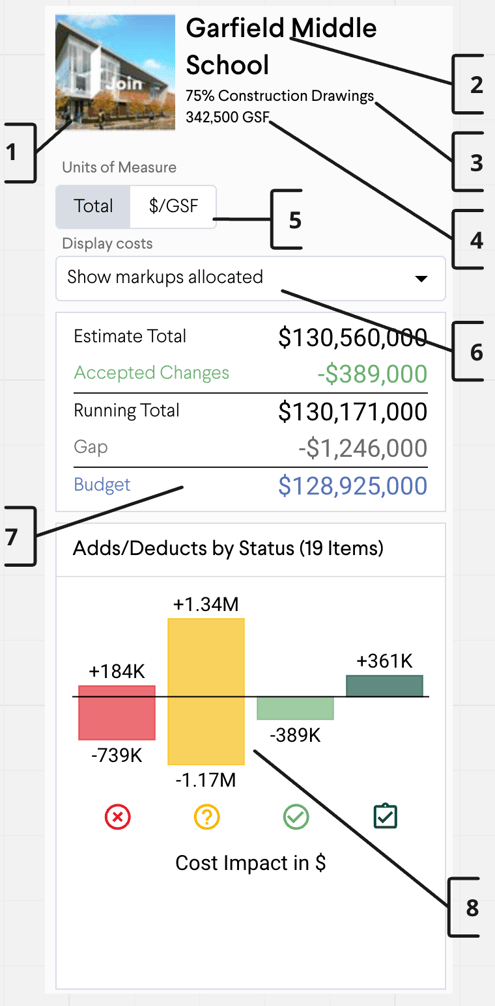
| 1 | Project Thumbnail |
The project thumbnail is an uploaded image file to help personalize the project.
|
| 2 | Project Name |
The project name is the name of the project and can be changed on the settings page
|
| 3 | Active Milestone Name |
The milestone that is currently active. All costs shown on reports reflect the active milestone. Active milestone is set on the milestone detail page.
|
| 4 | Project Metrics |
The total size of the project, which though you can see rolled up cost (e.g., $600/gsf
|
| 5 | Units of Measure |
View project cost via units of measure to track and use to display unit costs (e.g., $/GSF, $/key)
|
| 6 | Display costs |
Allocated all markups pro-rata, Do not allocate markups, Markups are not displayed or included in totals
|
| 7 | Project Cost Summary |
Summarized view of key cost indicators on the project. This includes Estimate, Running Total, and Budget.
|
| 8 | Item Chart - Add/Deducts by Status |
The cost impact of Items grouped by status or categorization. The hyperlink redirects to a filtered Item List
|
Project Navigation Bar

| 1 | Homepage button | The homepage button navigates you to the project list page. |
| 2 | Dashboard, Reports, Items, Milestones, Settings, Team Tabs |
The project navigation bar navigates you to the project's respective pages.
|
| 3 | New Item Button |
Launches New Item window so you can create new Items in the project
|
| 4 | Notification Bell Button |
The notification bell contains important notifications related to Item comments, @ mentions, assignments, etc.
|
| 5 | Help menu |
The help menu contains What's new in Join, Contact Support email, Help Center, and Keyboard shortcuts
|
| 6 | Profile menu |
The profile menu contains the profile edit menu, where you can change your profile picture, name, and title. The button also contains the logout button.
|
Dashboard
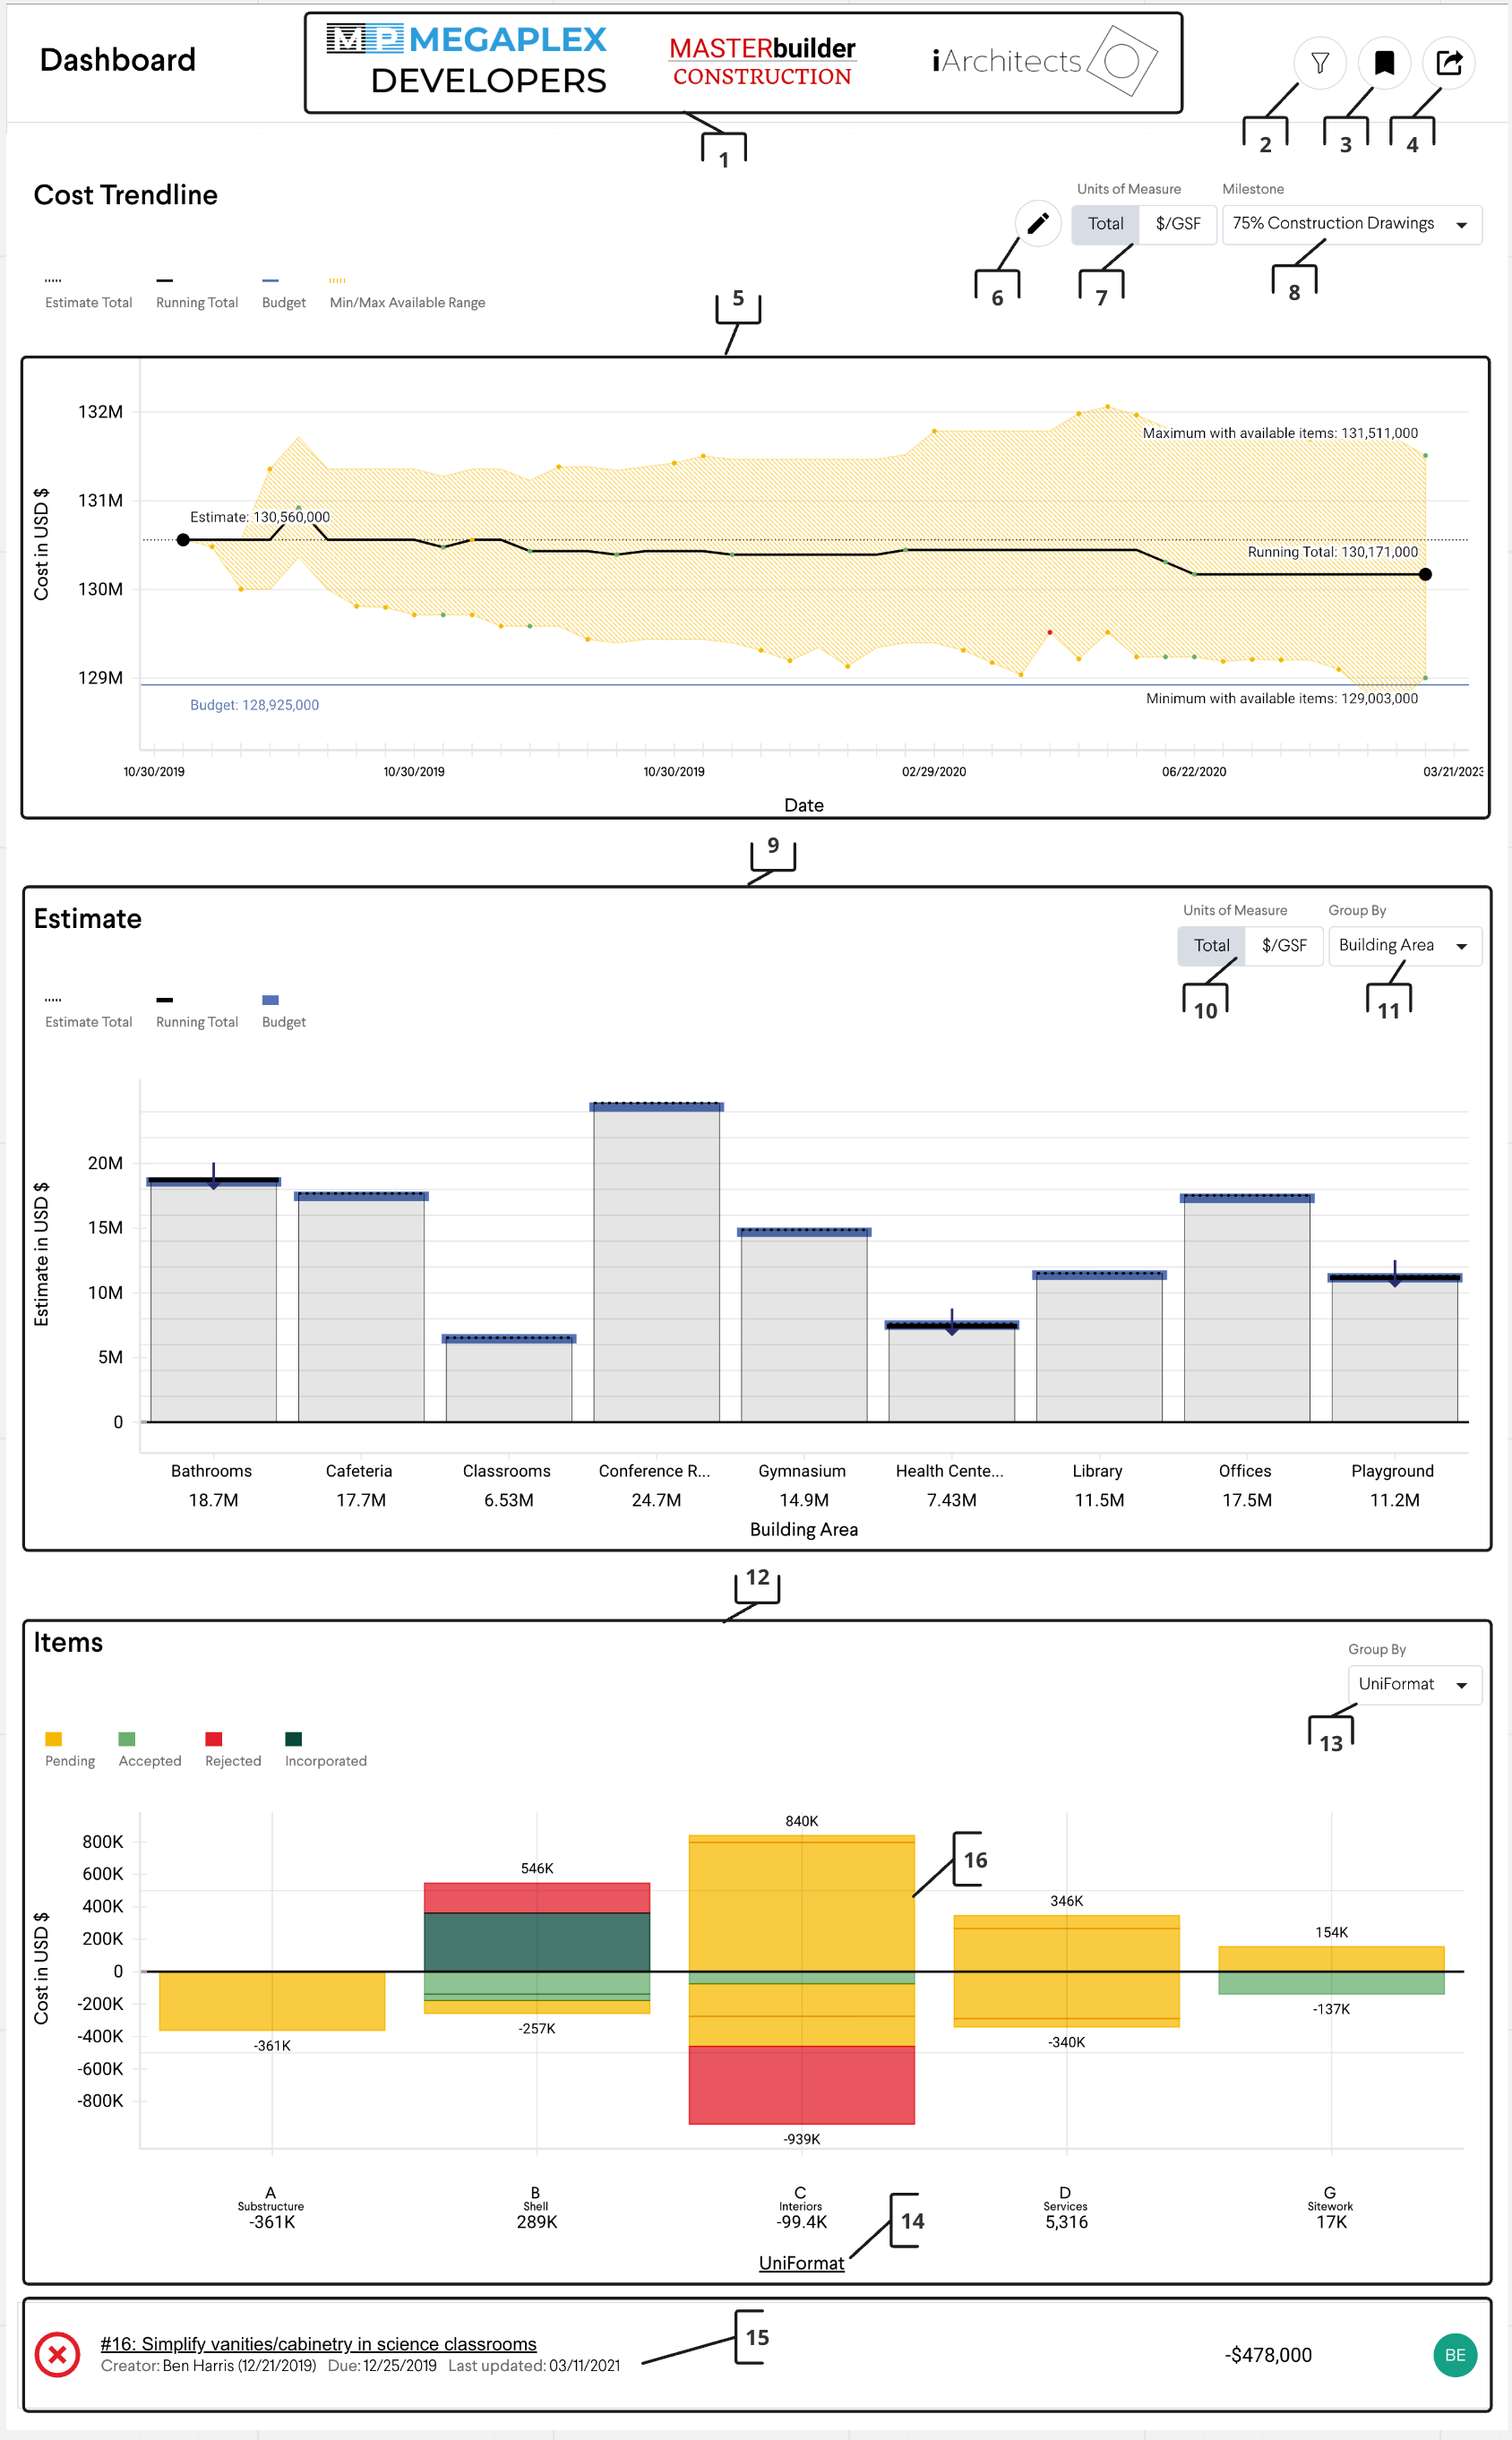
| 1 | Print Header |
The print header can contain the logo of the project stakeholders. You can upload a print header on the settings page.
|
| 2 | Filter Button |
The Dashboard filter button allows you to filter down cost data by category
|
| 3 | Reports Button |
The reports button allows you to create a new report of the current view or switch to a previously saved report
|
| 4 | Print Button |
The print button allows you to print the Dashboard page as a PDF. It allows contains several other Dashboard reports.
|
| 5 | Cost Trendline > Chart |
The cost trendline chart shows you a view of Items and how they're trending in the active milestone and the Estimate Total, Running Total, Budget, and Min/Max Available Range available in the project. You can also toggle to a trend of all milestones on the project over time.
|
| 6 | Cost Trendline > Show/Hide Events button |
The Show/Hide Event button opens the Hide Events window, where you can hide events from the trendline.
|
| 7 | Cost Trendline > Units of Measure toggle |
The Unit of measure toggle allows you to see costs in the chart divided by the project metrics, e.g., $600/GSF.
|
| 8 | Cost Trendline > Milestone drop-down |
The milestone drop-down menu allows you to switch the trendline view between the Active Milestone and all Milestone on the project.
|
| 9 | Estimate > Chart |
The estimate chart is a visualization of the Active Milestone Estimate and Budget.
|
| 10 | Estimate Chart > Units of Measure toggle |
The Unit of measure toggle allows you to see costs in the chart divided by the project metrics, e.g., $600/GSF.
|
| 11 | Estimate Chart > Group By drop-down menu |
The Group By drop-down menu allows you to change the chart cost view to another category in the project. e.g., UniFormat, MasterFormat.
|
| 12 | Items > Chart |
The Item chart is a visualization of all the Items in the Active Milestone grouped by a category.
|
| 13 | Items > Group By Status/Categorization drop-down menu |
The Group By drop-down menu allows you to view Items either grouped by status or any category in the project that the Items are associated with.
|
| 14 | Items > Chart hyperlink (under the chart) |
The Item chart hyperlink navigates you to the Item List grouped by the categorization of the chart
|
| 15 | Items > Item tooltip |
The Item tooltip previews the item, including the item name, cost, assignee, and attachments.
|
| 16 | Items > Item hyperlink |
The Item hyperlink navigates you to the detailed view of the item
|
Reports
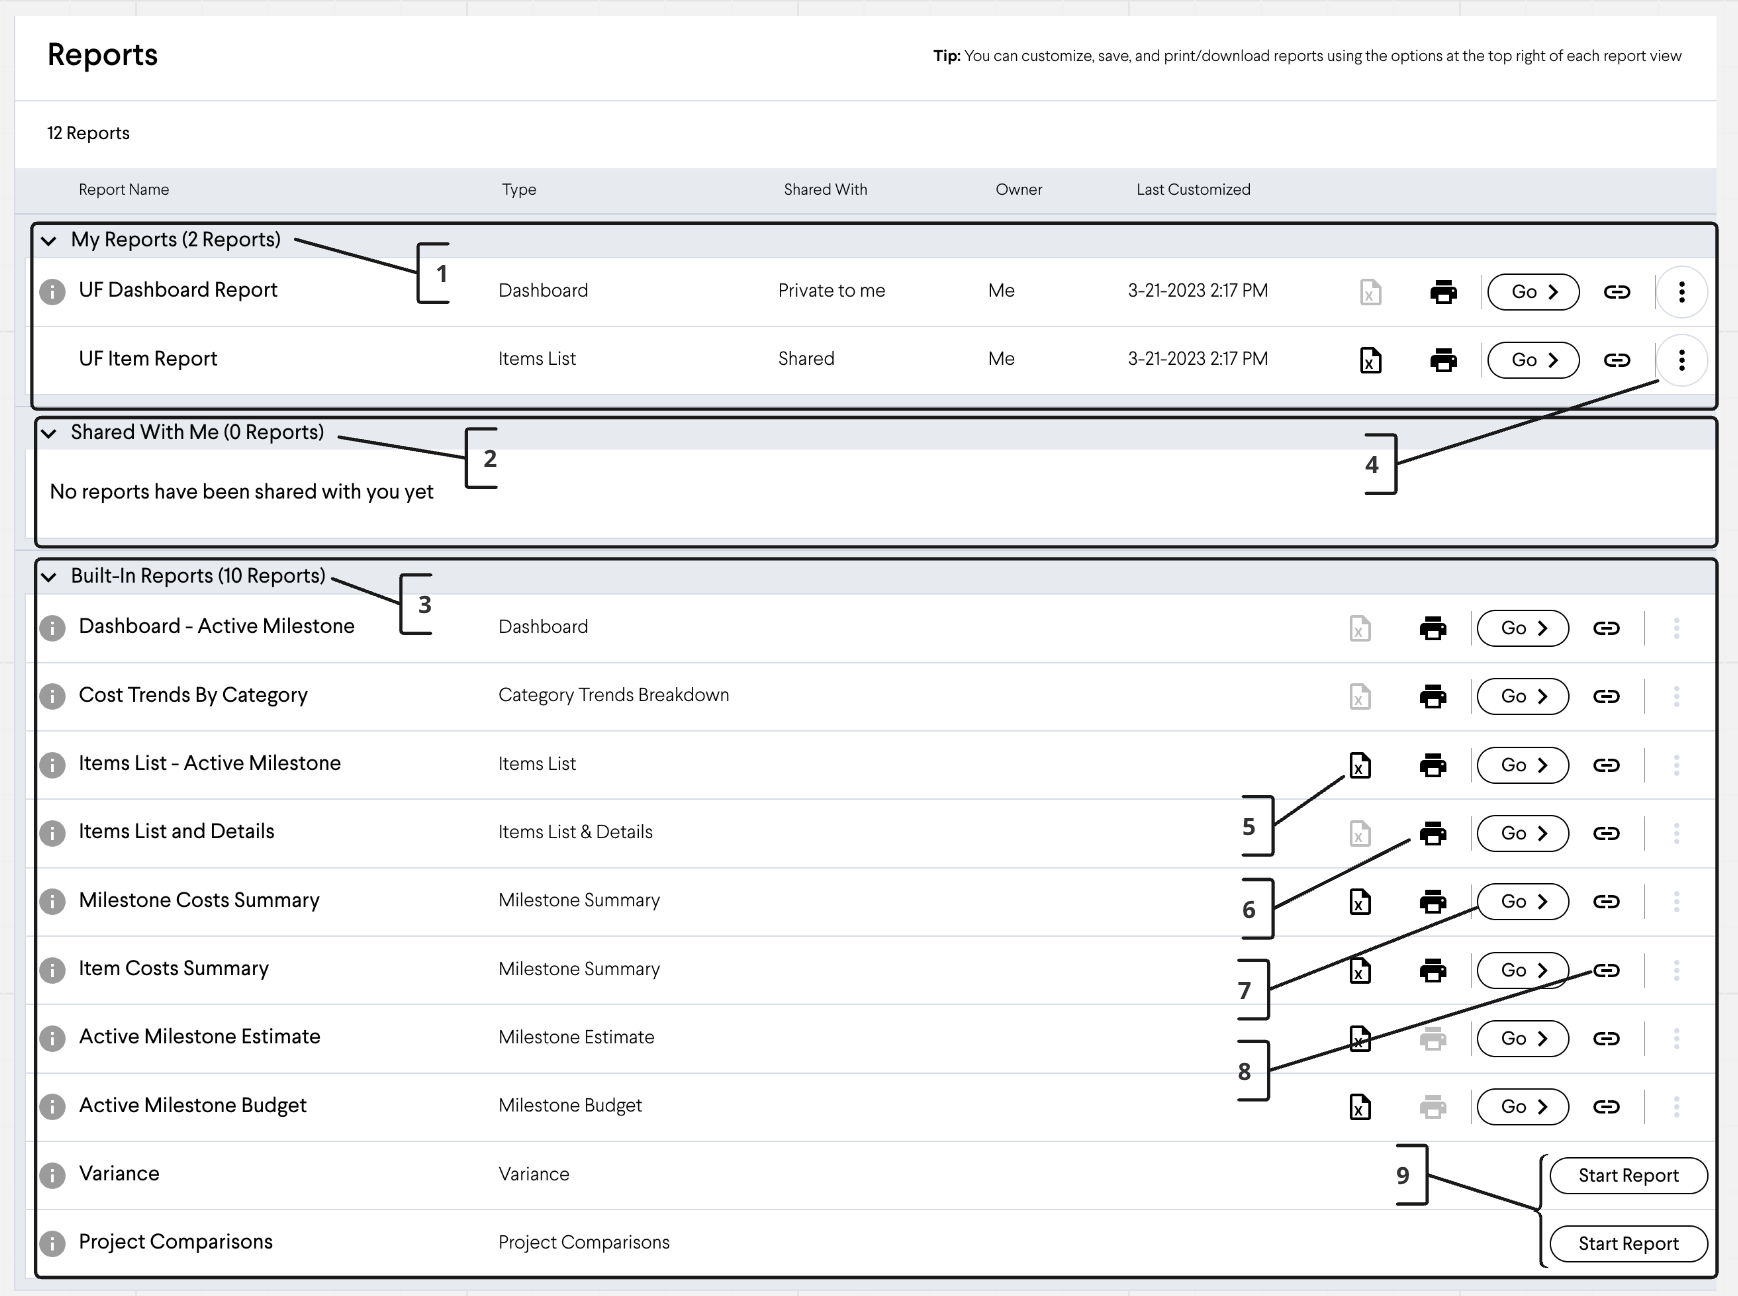
| 1 | My Reports |
My Reports shows all the reports that you've created in the project. They can be private to you or shared with others
|
| 2 | Shared With Me |
Shared With Me reports show all the reports created by other users that are viewable by all project collaborators
|
| 3 | Built-In Reports |
Built-In reports are all the reports available to you out of the box. These are not editable, but you can make and customize a copy.
|
| 4 | Options Button |
The options button allows you to edit or delete your reports. This is greyed out on reports you cannot edit or delete.
|
| 5 | Excel Button (Download as .xlxs) |
This button downloads the report to Excel file format. If the button is greyed out, the report is not downloadable in Excel file format.
|
| 6 | Print Button (Print or Export to PDF) |
This button prints the report to paper and exports the file to PDF file format.
|
| 7 | Go Button (View in Join) |
This button launches the live view of the report in Join.
|
| 8 | Hyperlink Button (Copy the Link to the clipboard |
This button copies the hyperlink to the live view of the report to your clipboard for pasting somewhere else.
|
| 9 | Start Report Button > Variance, Project Comparisons |
This button launches the Variance Report wizard to generate a new Variance Report.
|
Item List
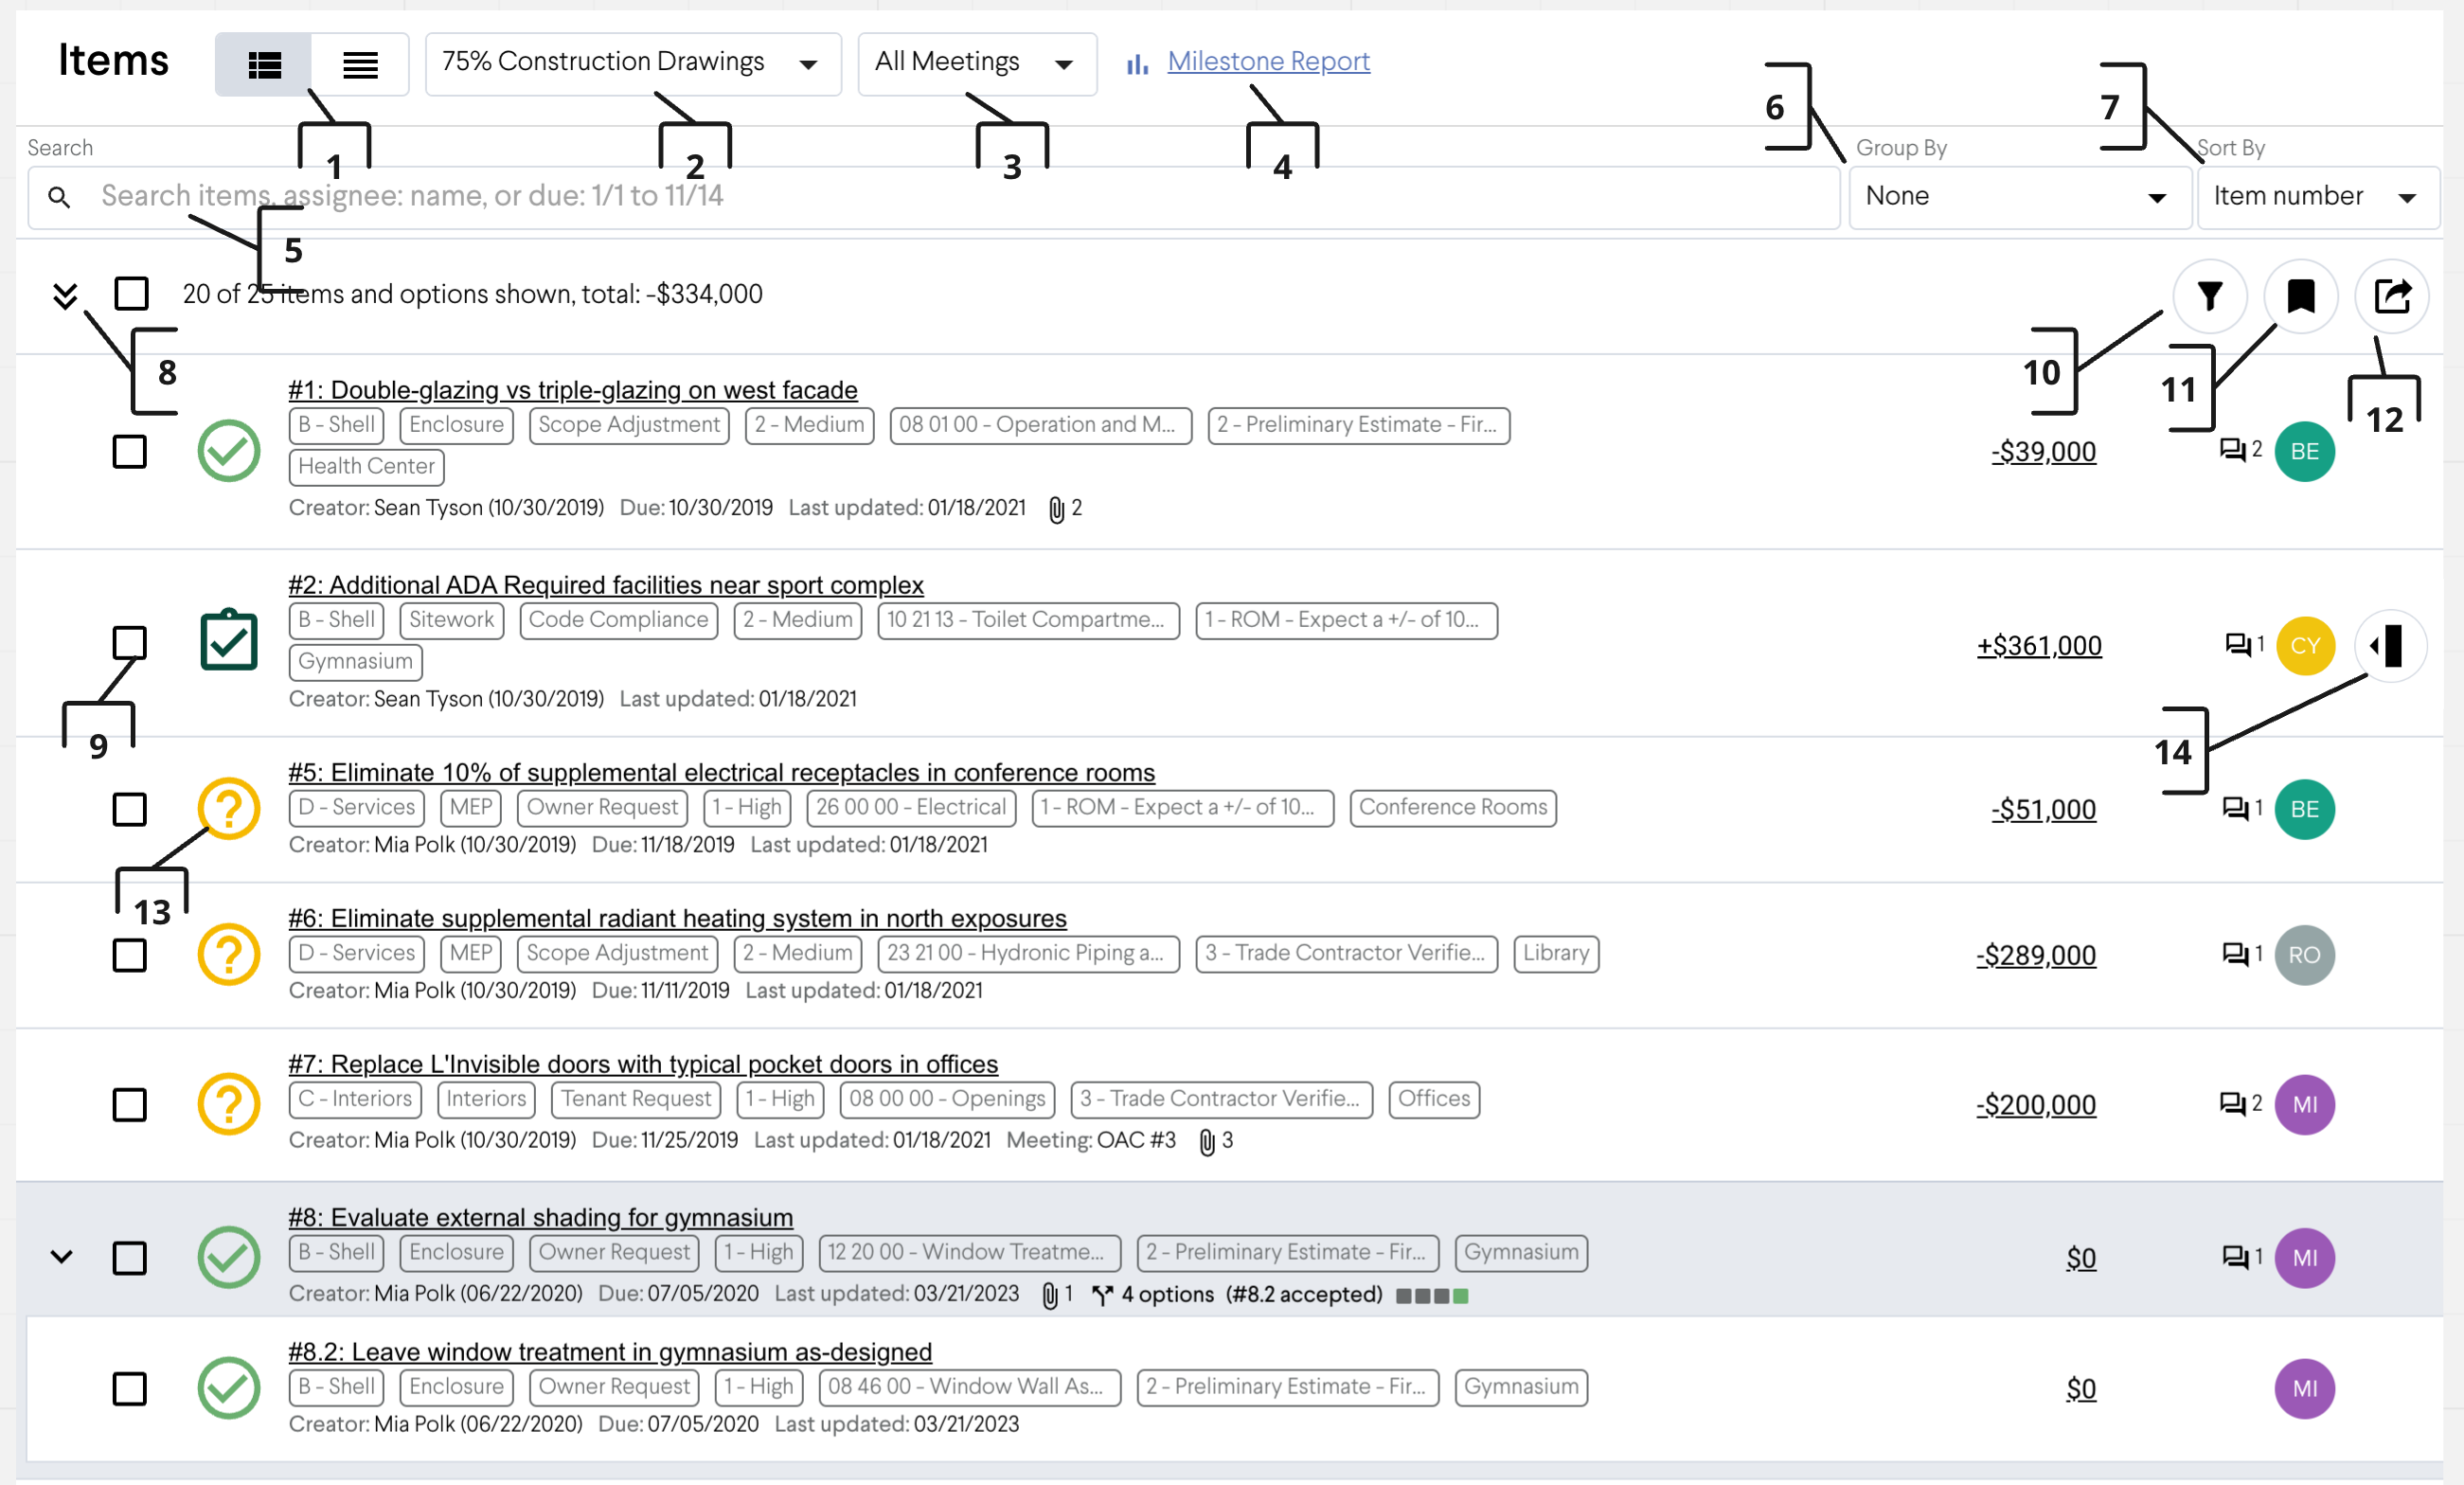
| 1 | Cozy/Compact View Toggle |
View toggles the Item list to a cozy view and compact view. The cozy view shows more Item details, but fewer Items are visible on the page. The compact view shows fewer Item details but more Items on the visible page.
|
| 2 | Milestone Drop-down menu |
This drop-down menu allows you to view items from other milestones or all milestones.
|
| 3 | Meetings Drop-down menu |
This drop-down menu allows you to filter the Item List to Items associated with Meetings.
|
| 4 | Milestone Report hyperlink |
This hyperlink redirects you to the Milestone Summary Report.
|
| 5 | Item Search bar |
This field allows you to search for items with keywords.
|
| 6 | Group By Drop-down menu > Status, Visibility, Meeting, Assignee, Creator, Categories |
This drop-down menu allows you to group the Item List by Status, Visibility, Meeting, Assignee, Creator, and Categories.
|
| 7 | Sort By Drop-down menu > Item Number, Status, Creator, Creation Time, Due date, Last Updated, Cost Impact, Magnitude, Categories |
This drop-down menu allows you to group the Item List by Item Number, Status, Creator, Creation Time, Due date, Last Updated, Cost Impact, Magnitude, and Categories.
|
| 8 | Expand/Collapse Button |
This button allows you to expand and collapse Item Groupings and Item Options.
|
| 9 | Item Checkboxes |
The Item Checkboxes allow you to select multiple Items at once to edit the item's Status, Meeting, Assignee, and Categories.
|
| 10 | Item List Filter Button > Show, Status, Visibility, Creator, Categories |
The Item List Filter Button allows you to filter the Item List by Item with Options, Status, Visibility, Meeting, assignment, Creator, and Category.
|
| 11 | Reports Button |
The reports button allows you to create a new report of the current view or switch to a previously saved report
|
| 12 | Print Button > Download .xlsx, Print List only, Print list and details without change history, print list and details with change history |
This button prints the report to paper and exports the file to PDF and Excel file format. You can also print the list and details without changing history, print the list and details with a change in history
|
| 13 | Item Status toggle button |
The Item Status toggle button allows you to change the status of the Item on the Item List.
|
| 14 | Show/Hide Item Sidebar Button |
The Item Sidebar button expands and collapses an Item Sidebar for quick viewing of an Item without leaving the Item List page. This button is also available on the Milestone Summary Report.
|
Milestone
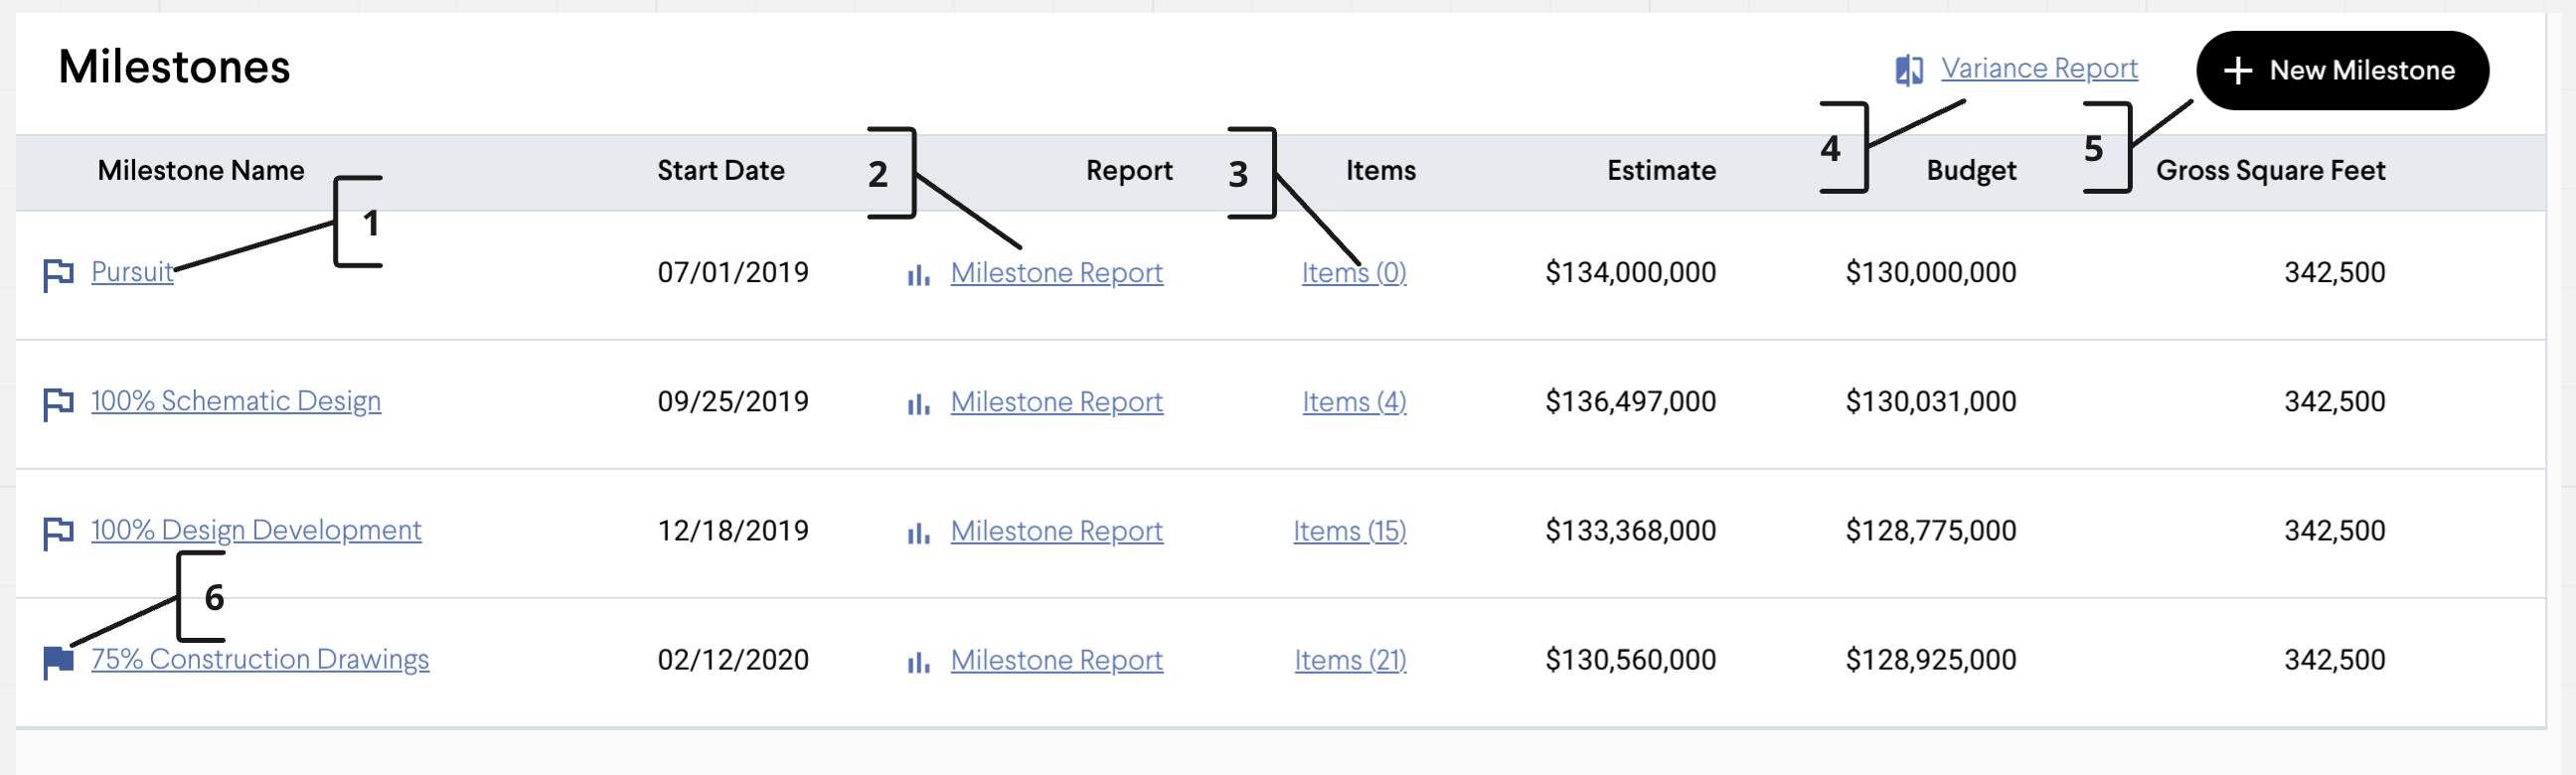
| 1 | Milestone Detail hyperlink |
The Milestone Detail hyperlink navigates you to the Milestone Detail Page.
|
| 2 | Item List hyperlink |
The Item List hyperlink navigates you to the Item List.
|
| 3 | Variance Report hyperlink |
The Milestone Report hyperlink launches the Milestone Summary Report.
|
| 4 | New Milestone Button |
The New Milestone Button allows you to create new Milestone in the project.
|
| 5 | Variance Report hyperlink |
The Variance Report hyperlink launches the Variance Report wizard report creator.
|
| 6 | Active Milestone Flag |
The Milestone Flag indicates which Milestone is currently active. A solid blue flag indicated a Milestone is active. A blue outline flag indicated the milestone is not active. Only one Milestone can be active.
|
Settings
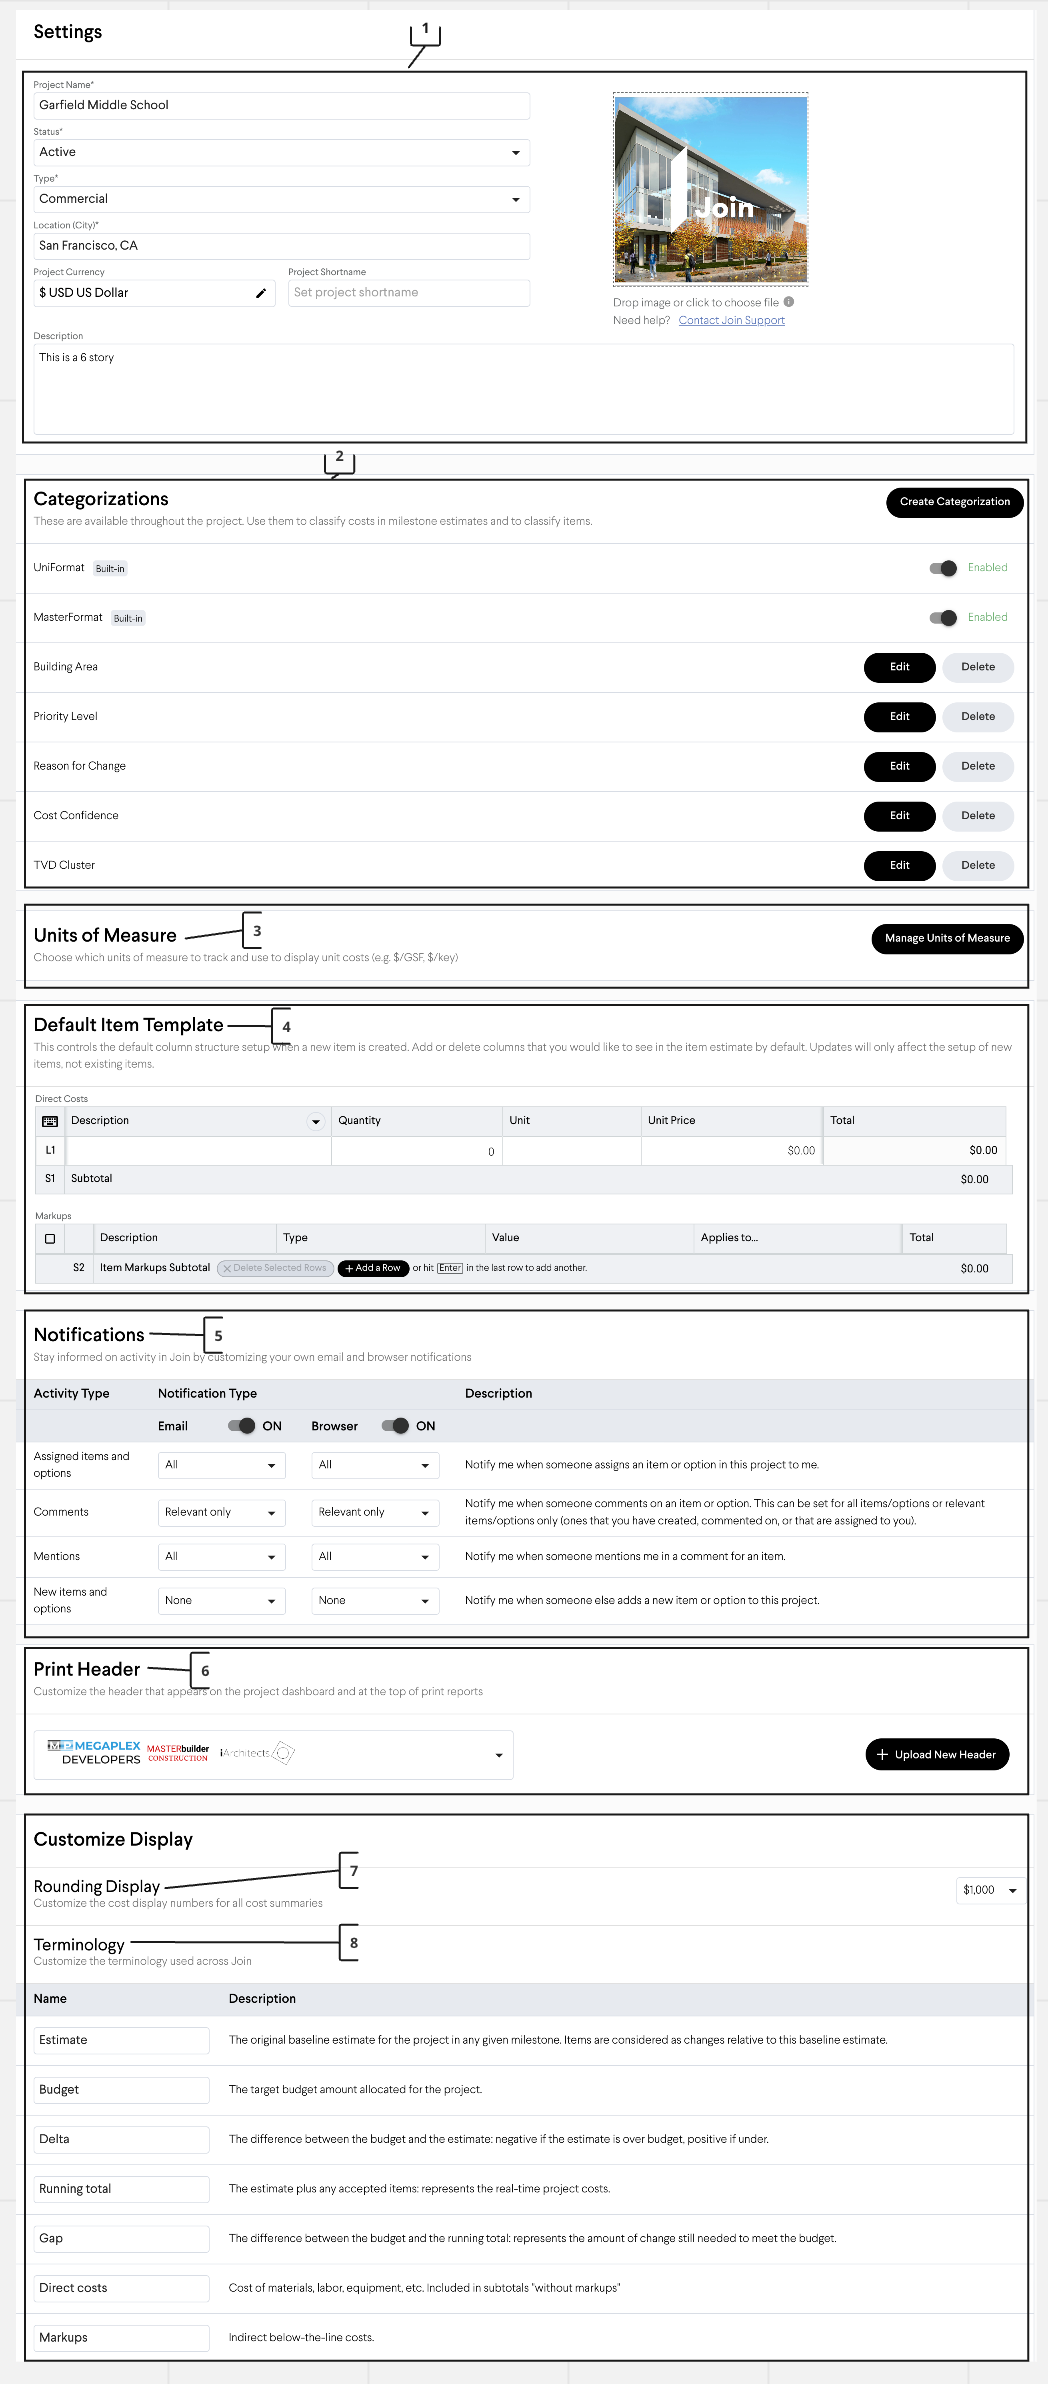
| 1 | Project Info > Project Name, Status, Type, Location, Project Currency, Project Shortname, Description, Project Thumbnail |
The Project info section of the Settings page allows you to modify the Project Name, Project Status, Project Type, Project Location, Project Currency, Project Shortname, Description, and Project Thumbnail.
|
| 2 | Categorizations |
These are available throughout the project. Use them to classify costs in milestone estimates and to classify items.
|
| 3 | Units of Measure |
Choose which units of measure to track and use to display unit costs (e.g., $/GSF, $/key)
|
| 4 | Default Item Template |
This controls the default column structure setup when a new item is created. Add or delete columns that you would like to see in the item estimate by default. Updates will only affect the setup of new items, not existing items.
|
| 5 | Notifications |
Stay informed on activity in Join by customizing your own email and browser notifications
|
| 6 | Print Header |
Customize the header that appears on the project dashboard and at the top of print reports
|
| 7 | Rounding Display |
Customize the cost display numbers for all cost summaries
|
| 8 | Terminology |
Customize the terminology used across Join.
|
Team
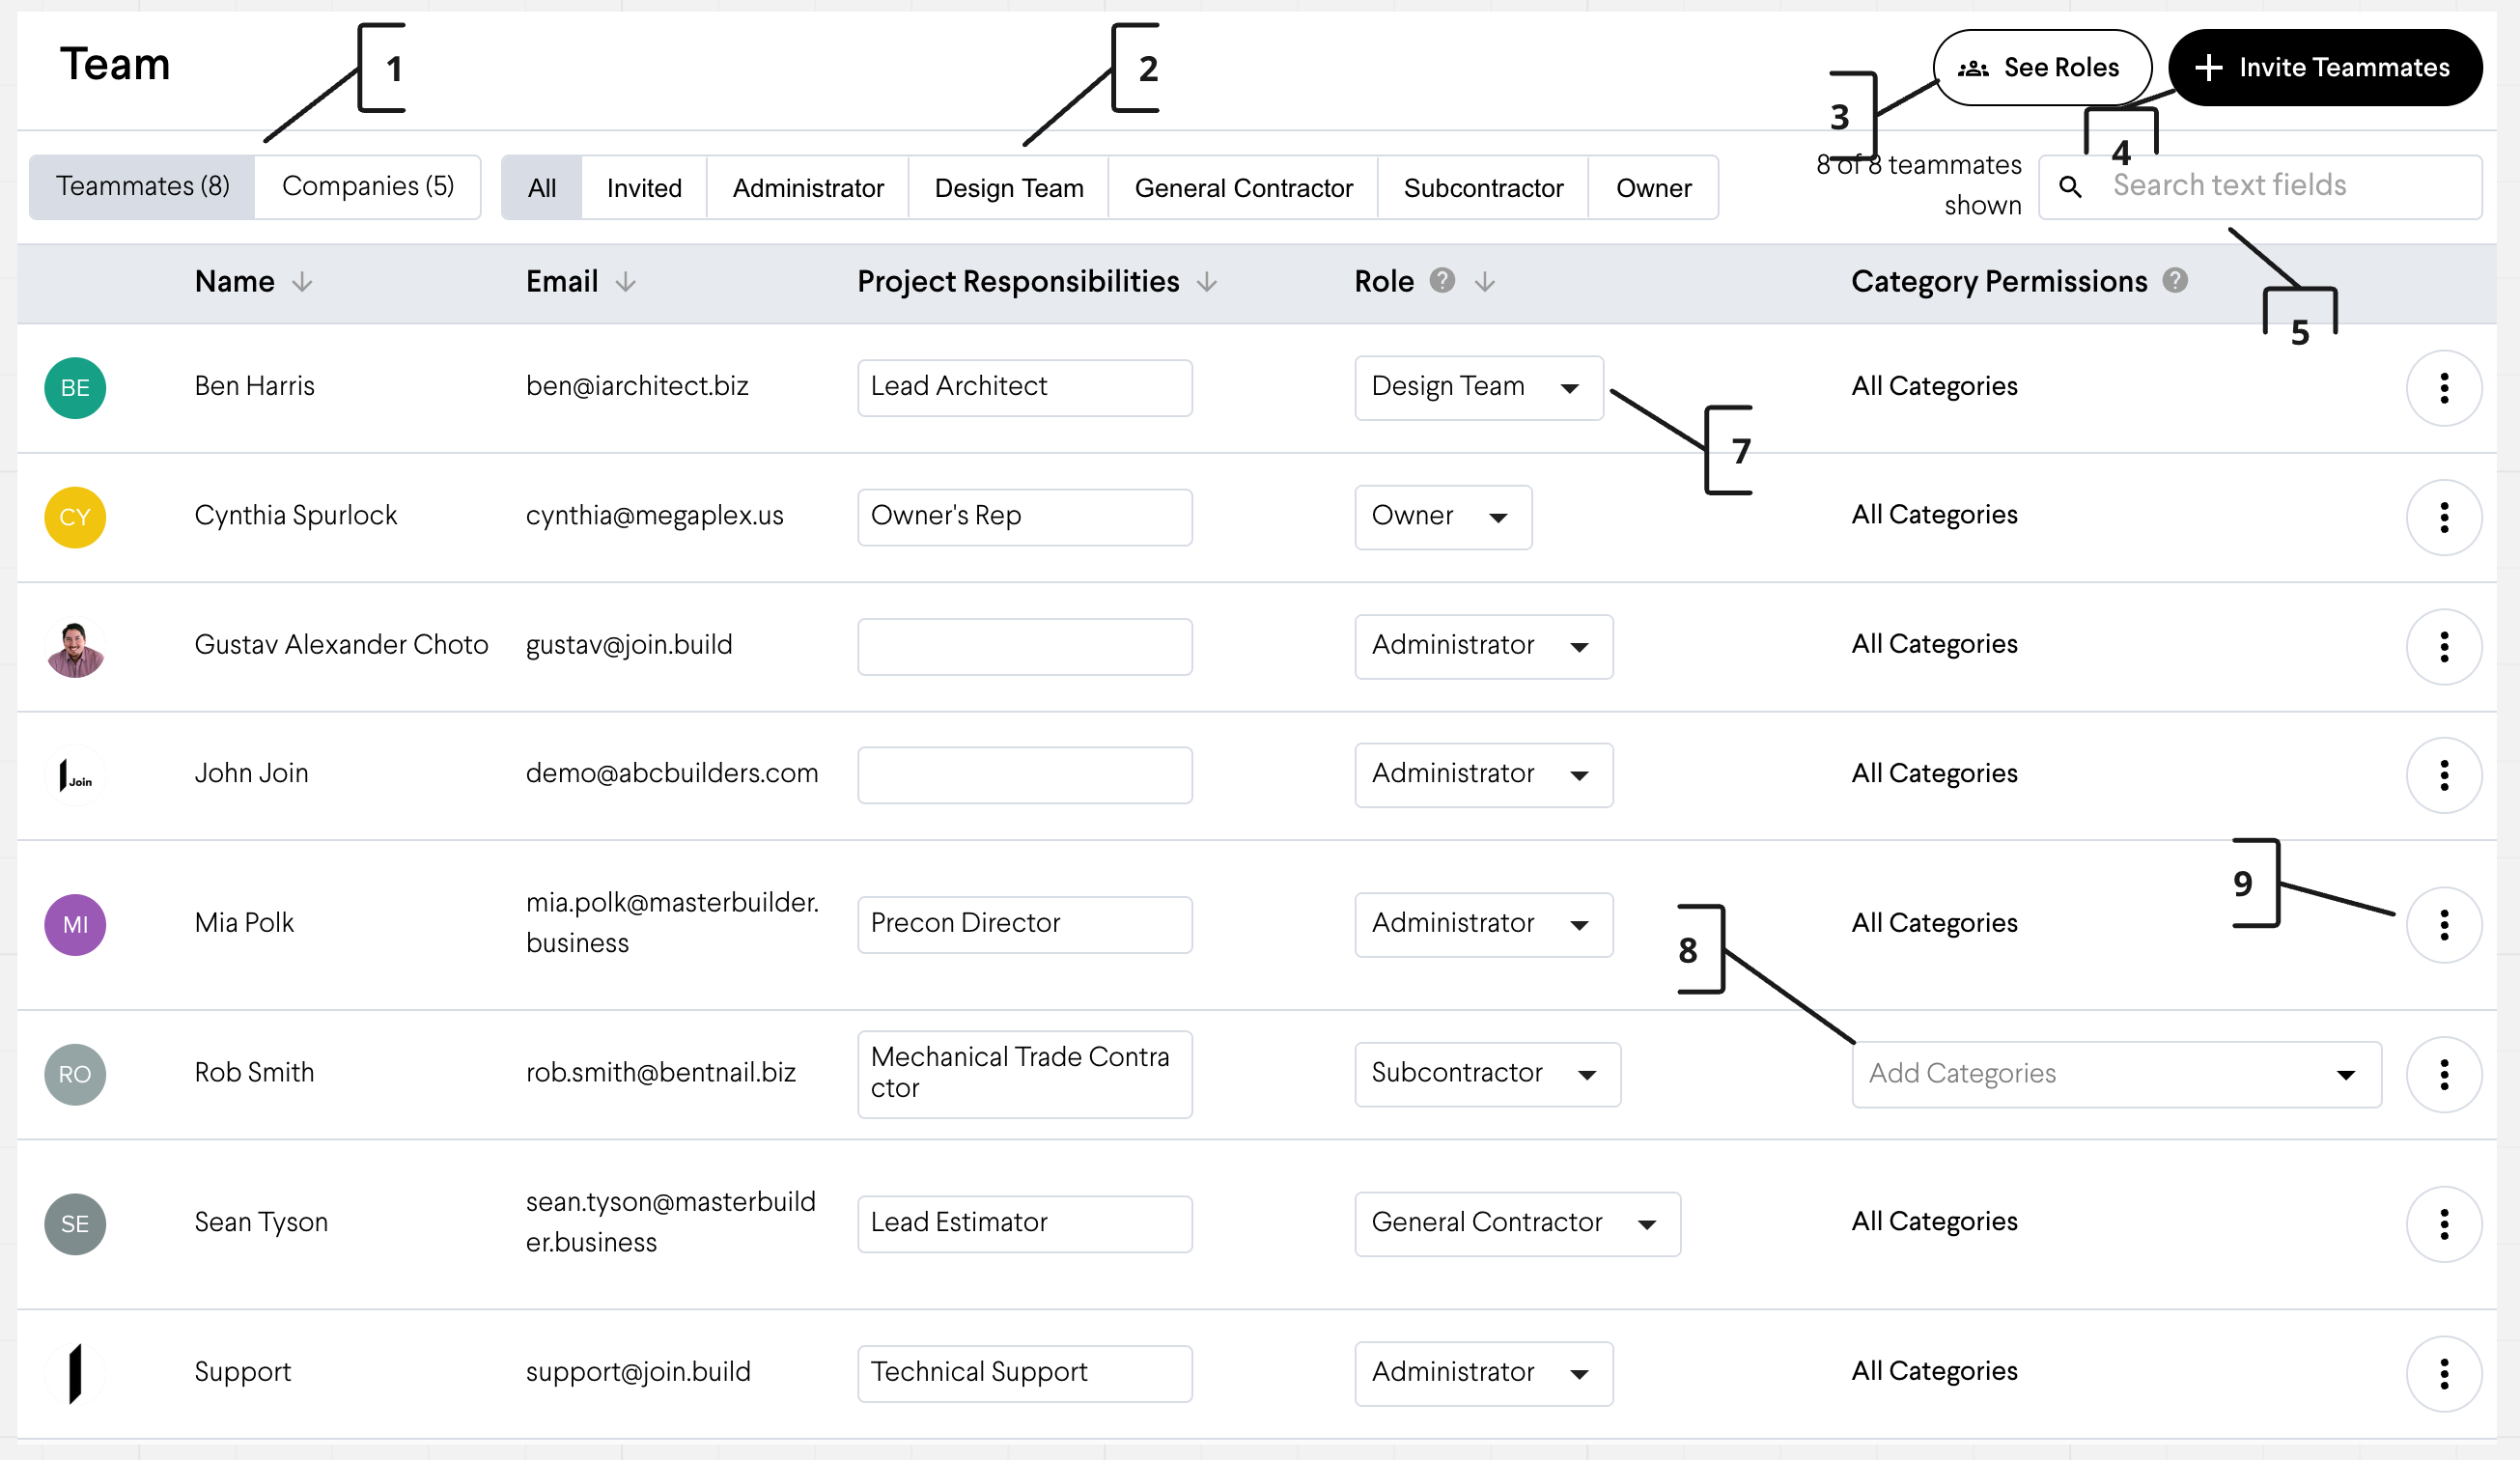
| 1 | Teammates/Companies Toggle buttons |
The Teammates/Companies Toggle allows you to view all users and all companies on the project.
|
| 2 | Teammate Roles Toggle button filter |
Teammate Toles Toggle buttons allow you to filter the list to only the selected role.
|
| 3 | See Roles Button |
The See Roles button allows your to view all Roles on the project and modify their permissions. The Roles Page has six default roles (Admin, Design Team, GC, Sub, Owner). These roles permissions can be modified and renamed. The Preview Role button allows you to view the project through the eyes of the selected role.
|
| 4 | Invite Teammates Button |
This button launches the teammate invitation window where you can select a role, add an email and add message.
|
| 5 | Search text fields |
This field allows you to search for teammates on the list
|
| 6 | Roles drop-down menu |
This drop-down menu allows you to change a teammates role.
|
| 7 | Teammate Option Button |
The options button allows you to remove the teammate, preview their role or resend them the project invite.
|
| 8 | Category Permissions |
If you want to limit access for a teammate to 8 a specific trade(s), you can set that here. Click the "view roles" button to see more detail or to enable/disable trade permissions.
|