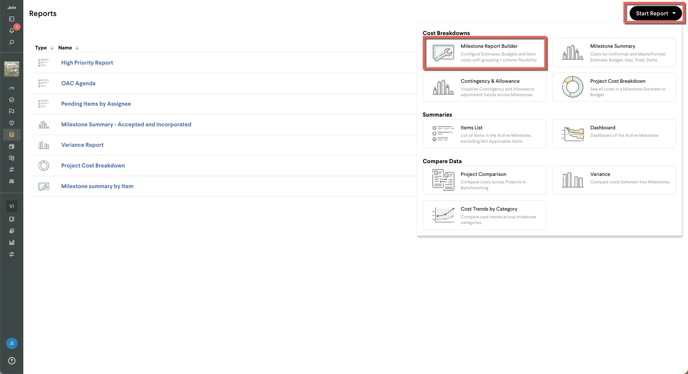
- To access the Milestone Report Builder, select
Reports in the Navigation bar. - Select Start Report in the top right of the Reports page.
- Select Milestone Report Builder in the dropdown.
Presets
When the report is first opened, there are two Presets to choose from that control which Estimate, Budget, and Item data are shown in the report. The Standard preset provides a summary of your Active Milestone with costs grouped with Estimate, Budget, Gap, Running Total and Delta. The Item Details preset includes an additional Item Details section as columns.
Select a Preset and select Start Report to begin configuring the report.

Organizing Cost:
Open the Edit Columns panel to select or de-select the columns shown in the grid.
Drag Categories or Line details from the Edit Columns panel to the Group By bar above the grid to change the grouping. Select
 ![]() to Autosize columns, Sort column, Group by column, or expand/collapse all rows.
to Autosize columns, Sort column, Group by column, or expand/collapse all rows.
By default projects will be grouped by the first category listed in the project categorization settings. When grouping by a Categorization, uncategorized direct cost lines will be grouped into an Uncategorized group. Markups/indirect costs won't be placed into any group, so you can group them separately (typically by Markup Name) and they will show up at the same level.
Note: If a new categorization was added since the last save, it will be hidden by default and appear at the bottom of the "Edit Columns" menu. An "Unsaved" alert will appear if categorizations were added or removed from the milestone. Click "Save changes" to update the report, even if you chose for the new columns to remain hidden.
Group By is available for the following columns:
- Line type
- Source
- Description
- Categorizations
- Item
- Item Status
- Assignee
- Markups Name
- Markups Type
- Markups Display Type
Tip: If your project has multi-level categorization, open the Edit Columns panel and drag additional levels to the Group By panel. If you want item details like status, assignee, etc. to show up on group rows when you're grouping by item, Item should be your last/lowest group
- Source
- Categorizations
- Item status
The following columns will be aggregated in the Total row at the bottom of the report, and in group rows: Line Cost, Totals, Total Cost, Type (LEMSOU) Totals, All Project Totals.
Important Note: When Milestone Estimate, Budget, and Item sources are all included in the Source column filter, your Total column will include both Estimate and Budget costs. Filter the source column or use the dedicated Project Totals columns to see these totals shown separately for each source.
Sorting
You can sort a column by clicking on the column header, or on its name in the "Group By" bar at the top of the report. To sort by multiple columns, hold down Shift while clicking each column in order.
Export to Excel
If you want to export a portion of the report, select the rows and columns you wish to export. Right click and select Export and chose Excel or CSV. The export will honor all expanded/collapsed rows, hidden columns and any filters applied in the report.
To export the full report to Excel select the export button ![]() and choose
and choose ![]()
Print to PDF
To print the report to PDF, select the export button ![]() and select Print report. Please note that the report will print using your browser and will require configuration to fit the report to the page.
and select Print report. Please note that the report will print using your browser and will require configuration to fit the report to the page.
Due to browser limitations, it is recommended to print to PDF by exporting to Excel or CSV and printing to PDF from Excel.
Saving a Report
When you save a Milestone Report Builder report, the following grid configuration properties are saved:
- Column order
- Column visibility
- Filters
- Row groups
- Row group expansion
- Sorting