Report Overview
The Cost Trends By Category report functions similarly to the All Milestones chart on the Dashboard. The Estimate (dotted black line), Running Total (solid black line), and Budget (blue line) are represented in each chart, with the Running Total, Gap, and Budget summarized at the top. You can select any categorization in the project by dropping down the category selection in the upper right-hand corner.
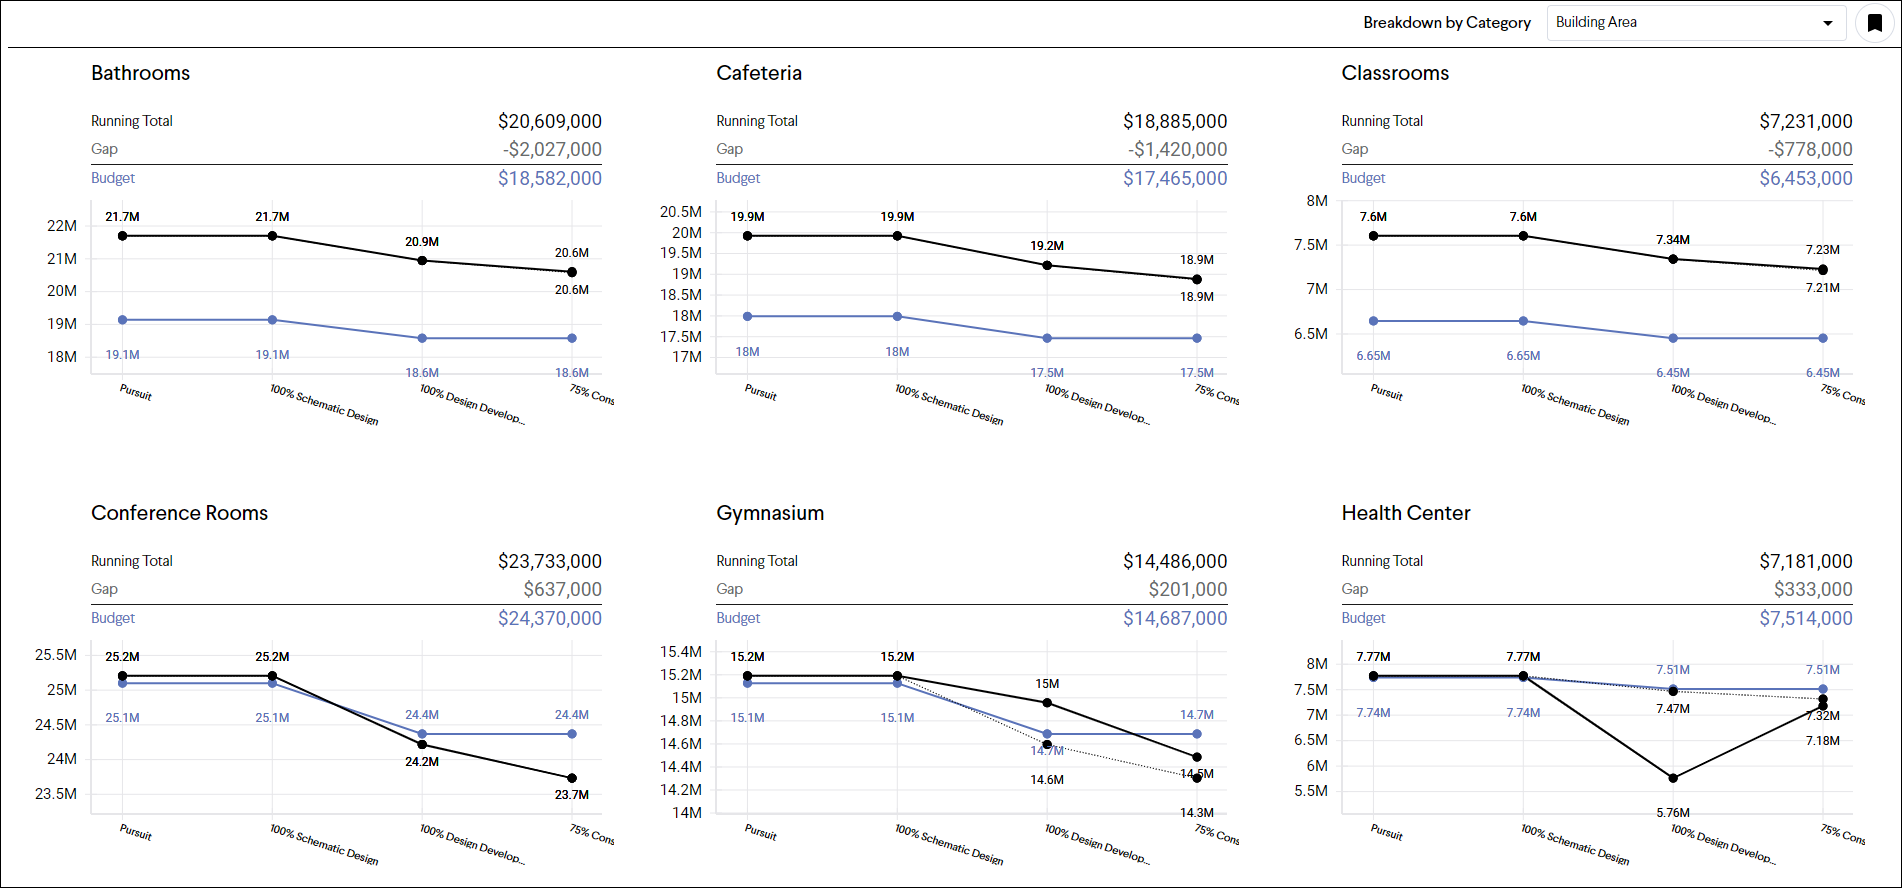
Tip: Selecting categories that are consistently used throughout all Milestone Estimates, Budgets, and Items will result in the best visuals.
Accessing the Cost Trends By Category Report
The Cost Trends By Category report can be accessed from two locations:
- From the Reports page, click the Start Report button. In the dropdown, select Cost Trends by Category.

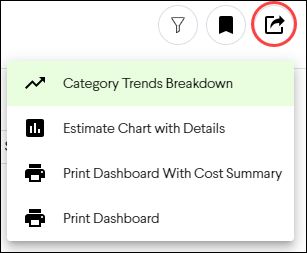
- From the Export button on the Dashboard tab select Category Trends Breakdown